FR
← Data Workers Dark version

The projects

Data turned into experiences to explore: football in relief, a city told through its buildings, the analysis of a tournament and automatically produced podcasts.

3D visualisation · Football

3D matches

Every Premier League, LaLiga, Serie A, Bundesliga, Ligue 1 and Champions League match becomes a landscape: the two teams fight over the pitch action by action, shots make hills and goals make peaks. Pick a matchday, then turn the map any way you like, on a computer or a phone.

Updated automatically after every match
Three.jsWhoScored / OptaFotMobPython
Pick a match →
Data visualisation · Football

Mbappé's shot flow

All 478 of Kylian Mbappé's shots for Real Madrid, followed from start to finish: where he shoots from, in what situation, with which foot, whether it goes in, then who gave him the pass and in which phase of play. The Sankey opens phase by phase, on click.

Interactive SankeyWhoScored / OptaFotMobMotherDuck
Follow the shots →
3D map · City

Luxembourg by age

The 23,373 buildings of Luxembourg City in 3D, at their real height and coloured by year of construction, with the history of the city and of those who governed it, from the castle of 963 to today. In French, English and Luxembourgish.

deck.glgeoportail.luOpenStreetMapWikidata
Explore the city →
Article · Analysis

AFCON 2025: masters of the continent

A look back at the 2025-26 Africa Cup of Nations, won by Senegal against Morocco in Rabat: the ten players who left their mark on the tournament, backed by statistics, and what it means for the 2026 World Cup.

FootballStatisticsData storytelling
Read the article →
Audio · Automation

The podcasts

Chronique Finance & Tech, the daily briefing on French finance and tech news, produced automatically (news monitoring, summary, voice-over), and Data Workers, the first podcast (2021-2022): guests explain how data transformed their jobs. Both in French.

A new episode every working day
Apple PodcastsSpotifyAI
Listen →
Data visualisation · Sport

The leagues on the map

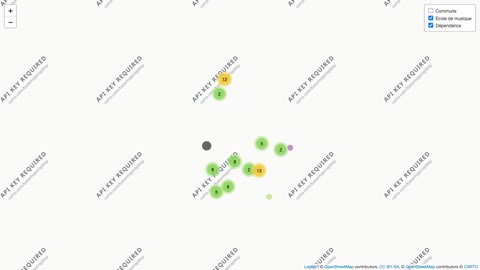
Fifty seasons of the French, English and Spanish leagues, the Champions League and the NBA: every club taking part is placed on the map, season after season, with titles by region and the timeline of champions.

PythongeoBoundariesWikipediaVideo
Choose a league →
Video · Data storytelling

The Ballon d'Or by league

Which leagues did the players ranked in the Ballon d'Or play in since 1976? The richest league in the world has only had three winners: the Premier League told through data, from Heysel to Italy's golden age (video in French).

FootballBallon d'OrVideo
Watch →
Before 2026

Earlier projects, 2025 → 2016
What came before the projects above, year by year, from the most recent to the oldest: 40 projects, from the football data of 2025 to the first R and Python scripts of 2016. Each card opens a page that explains the project and shows it in action. The code is on GitHub.

2025 Football in data

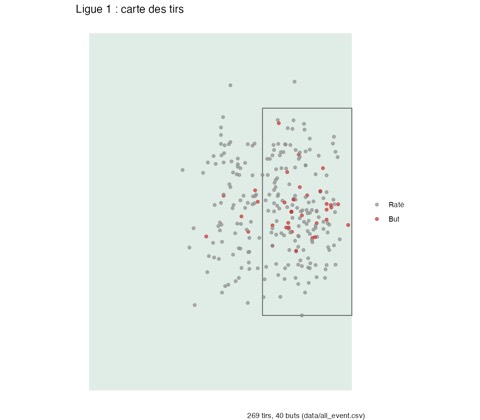
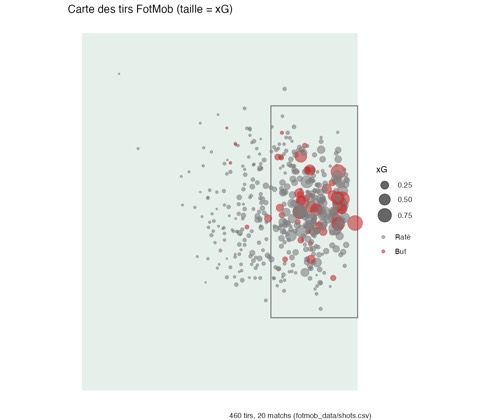
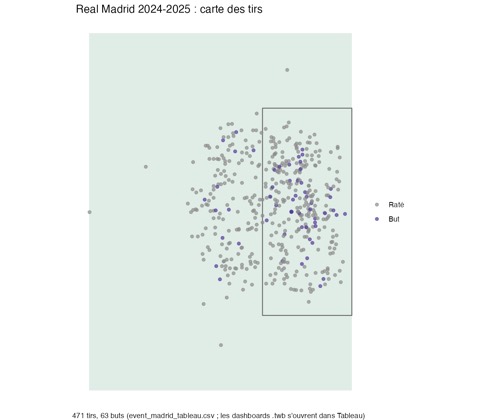
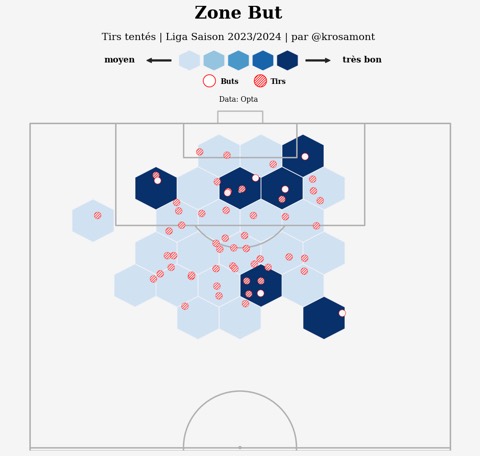
A real football data collection takes shape: FotMob, WhoScored, a consolidated Ligue 1, a match analysis app and Tableau dashboards on Real Madrid.

2024 Automate and measure

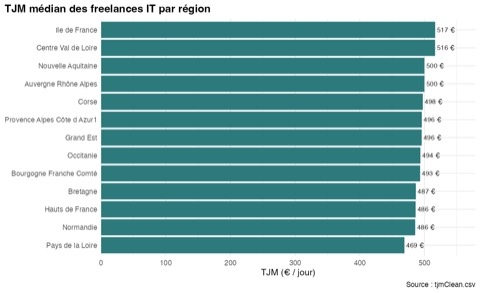
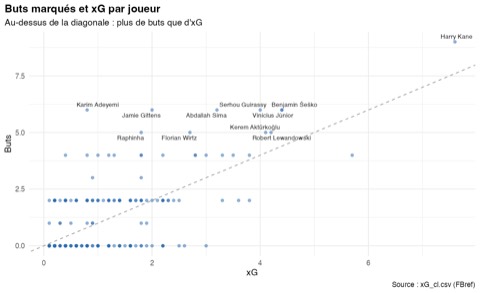
LinkedIn metrics flow into Notion on their own, freelance day rates are mapped, and football is back in the spotlight with the xG and xA of Europe's best players.

2023 Compare to see where you stand

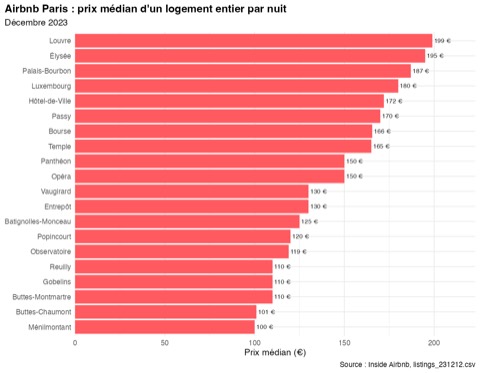
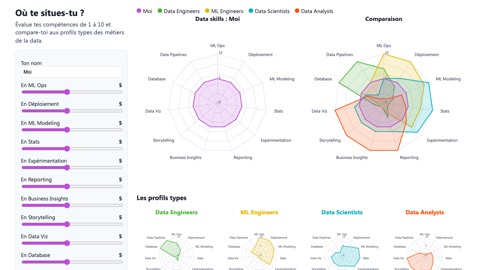
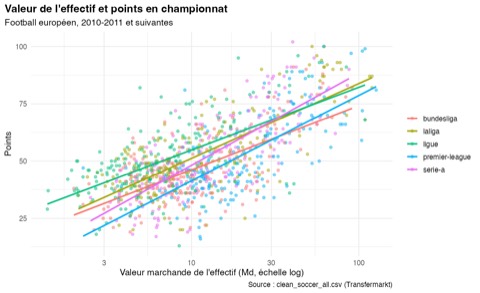
A radar to measure your skills against data jobs, Paris Airbnb listings neighbourhood by neighbourhood, and a touchy sports question: does money buy the league table?

2022 Scrape and tell

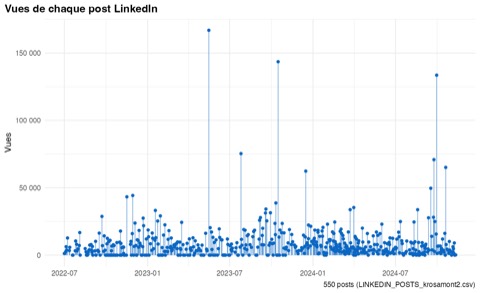
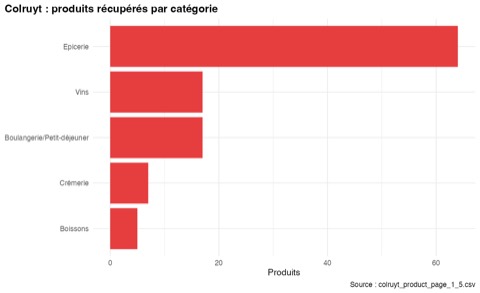
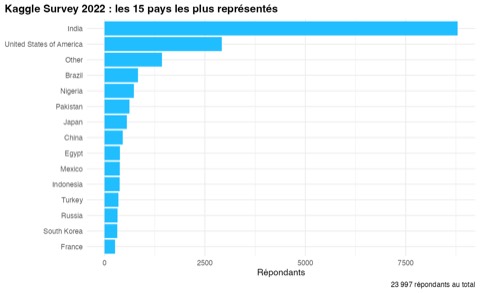
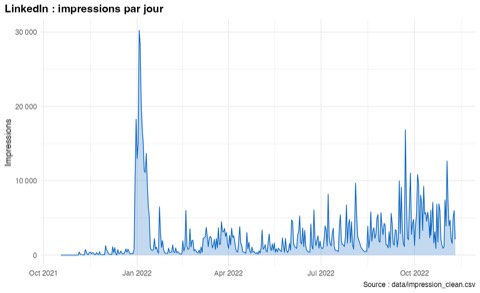
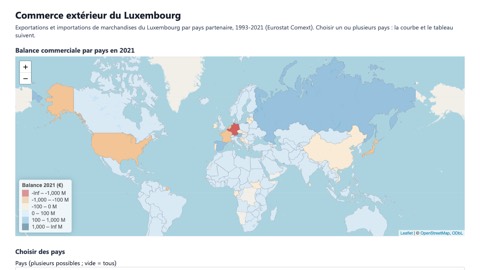
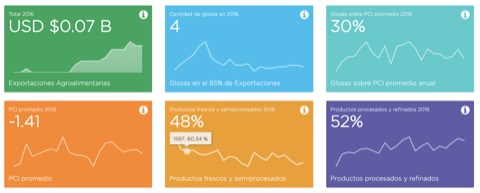
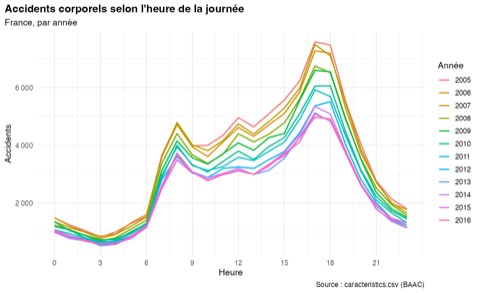
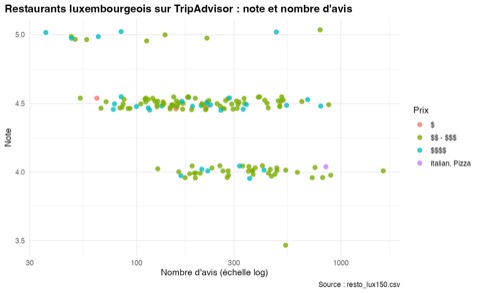
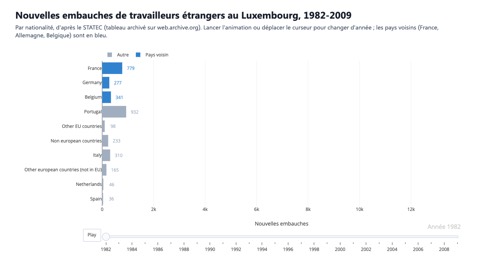
Data collection speeds up (TripAdvisor restaurants, Colruyt products) and the stories multiply: thirty years of Luxembourg's foreign trade, road accidents in France, shopping baskets, the Kaggle survey, the reach of LinkedIn posts.

2021 Useful applications

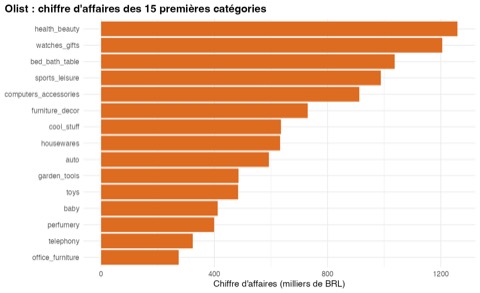
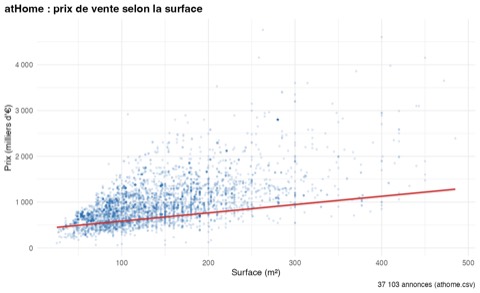
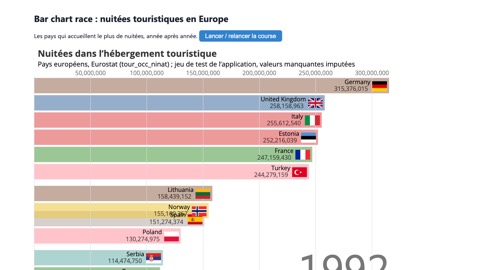
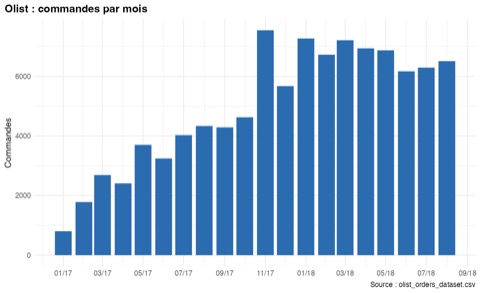
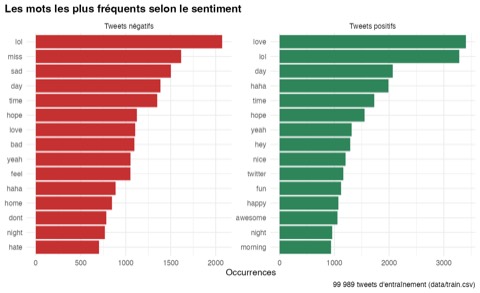
Tools built to be used: a bar chart race on any Eurostat dataset, Luxembourg's local services on a map. And models: housing prices, tweet sentiment, Brazilian e-commerce.

2020 Passing it on

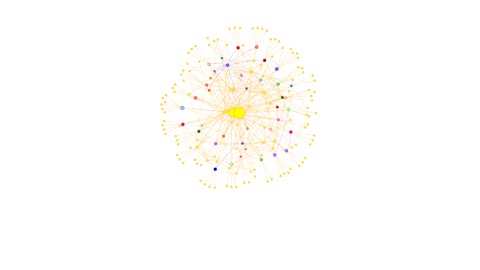
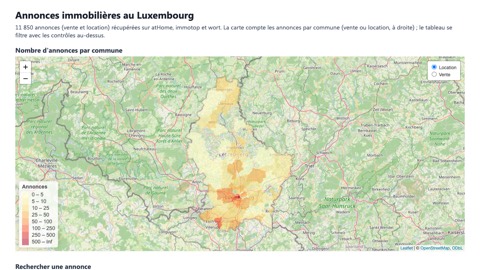
Sharing becomes as important as building: a complete R course, in slides, sees the light of day. On the project side, the Luxembourg housing market is mapped and the CAC 40 shareholding network is revealed.

2019 Data to understand

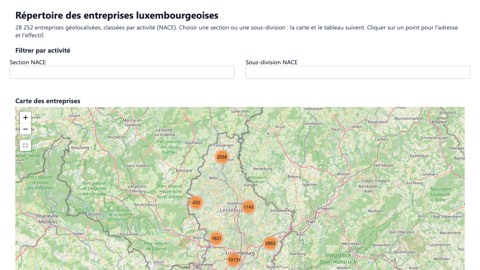
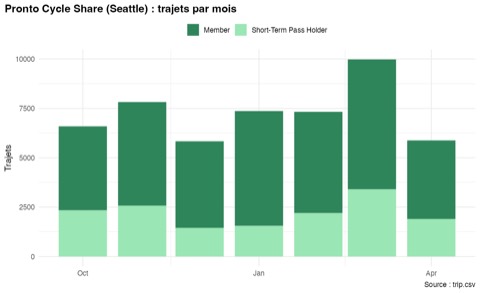
Every project starts with a question. Where are Luxembourg's companies and what do they do? How do Seattle's bikes get around? Why does a handful of causes produce most of the effects?

2018 Setting numbers in motion

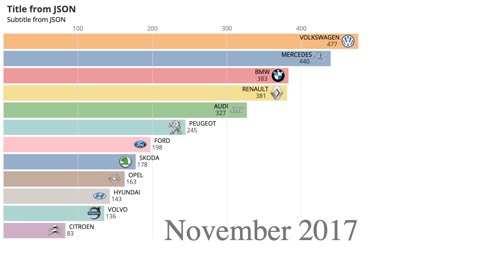
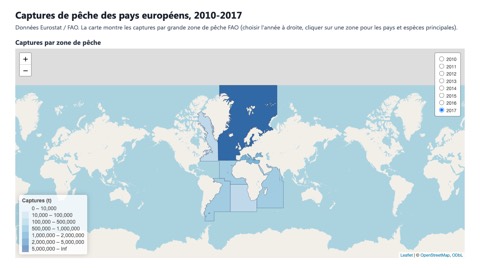
Data comes to life: a bar chart race animates new car sales in Luxembourg, and an interactive map follows European fishing catches, area by area.

2017 Shiny, D3 and open data

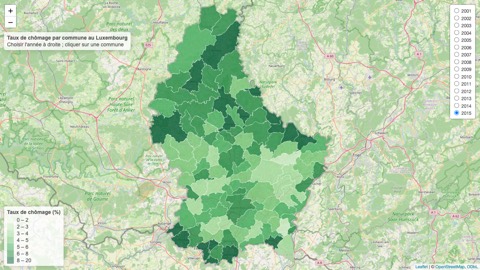
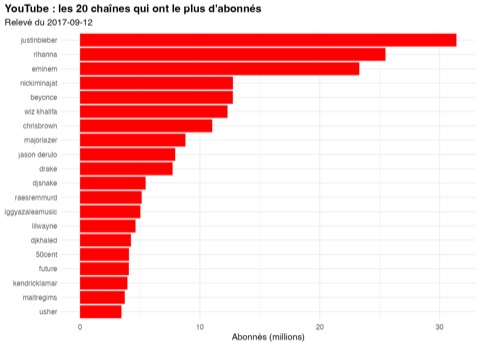
Ambitions grow: D3.js finds its way into Shiny, unemployment in every Luxembourg municipality goes on a map, the subscriber counts of French rap YouTube channels are recorded day after day and the big five leagues are collected season by season.

2016 The beginnings

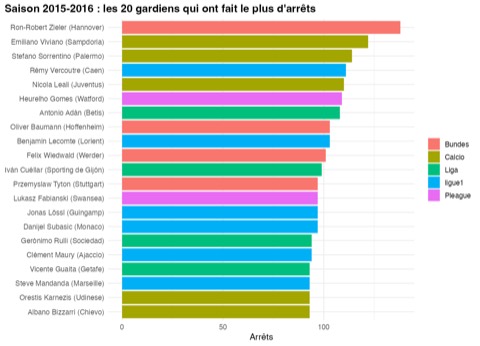
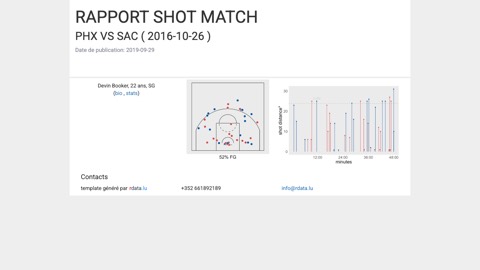
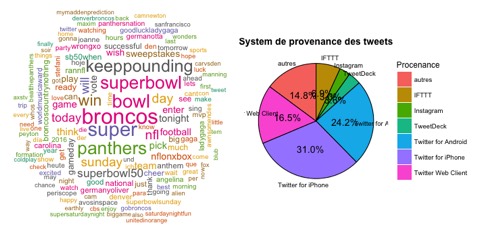
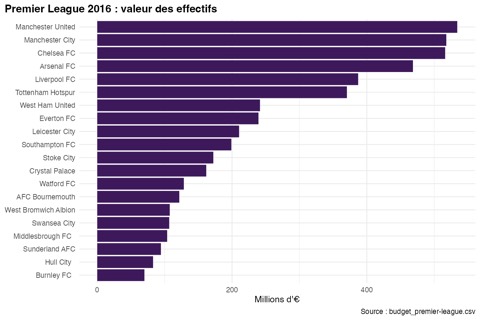
It all starts with a passion: sport. The first Shiny apps rank football clubs, NBA player sheets write themselves and Twitter becomes the first playground for text analysis.